This web page was produced as an assignment for Genetics 564, an undergraduate course at UW‐Madison.
What is phylogeny?
Phylogeny is the evolutionary relationships and relatedness among different species or populations. [1]
How to read a phylogenetic tree?
A phylogenetic tree is a branching diagram used to depict the evolutionary relationships among various entities based upon similarities and differences in their phenotypes and/or genotypes. [2]
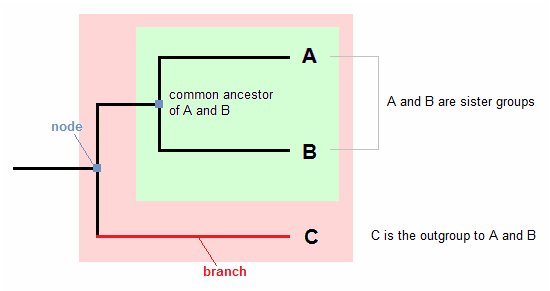
Figure 1. Features of a phylogenetic tree.
- The tips of the tree (alphabets) represent groups of descendant species.
- The nodes represent the common ancestors of descendants.
- Descendants that split from the same node are called sister groups.
- The branch lengths indicate the amount of character change.
- A clade (colored rectangle box) is a group of organisms that includes an ancestor and all its descendants. [2]
Types of phylogenetic trees
Average distance tree assumes a constant rate of evolution across lineages. Average distance trees are generated using alignments of homologous sequences to infer closest relatives in context of the gene of interest.
Neighbor joining tree does not assume a constant rate of evolution across lineages. Generation of neighbor joining trees does not require alignments of homologous sequences, therefore the trees do not infers the similarity of the homologous genes of interest. [3]
Neighbor joining tree does not assume a constant rate of evolution across lineages. Generation of neighbor joining trees does not require alignments of homologous sequences, therefore the trees do not infers the similarity of the homologous genes of interest. [3]
Phylogeny of MAOA gene homologs
Homologous sequences provide useful information in taxonomic classification and phylogenetic studies of organisms. We can trace the relatedness of organisms using the similarity of their homologs. Closely-related organisms tend to display very similar sequences between homologs, whereas evolutionarily distant organisms tend to display a greater divergence in their sequences.
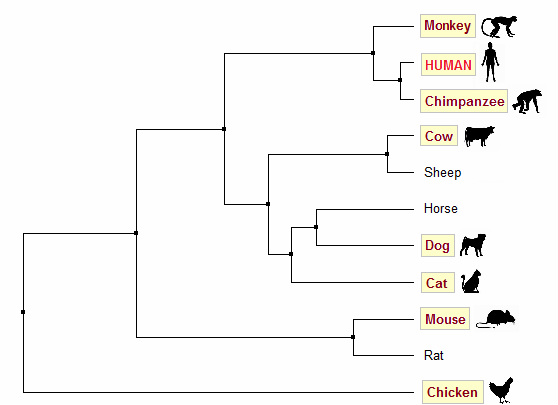
Figure 2. Average distance tree generated using % identity
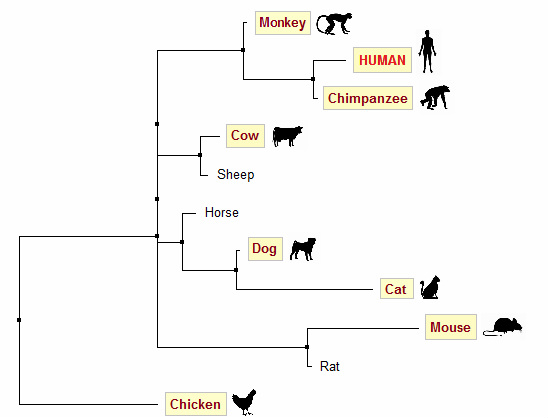
Figure 3. Neighbor joining tree generated using % identity
Methodology
Sequences of homologs in interest were aligned using Clustal Omega, then entered into Jalview to generate trees.
Trees above were generated using % Identity method (a.k.a. PID - Percentage Identity), an algorithm which creates tress by comparing the similarity of the actual sequences of homologs. [4]
In Jalview, trees can also be generated using the BLOSUM62 matrix. BLOSUM62 references relative frequency of one amino acid to be substituted for another, then uses these likelihoods to determine the probability for a mutation to occur. [5]
For these homologs however, trees generated using BLOSUM62 are not very accurate. Based on common knowledge about evolution, we would expect human, chimpanzee and monkey to be put in one clade; mouse and rat in another. Trees generated using PID (Figures 2 & 3) are in accordance with this prediction, whereas both trees generated using BLOSUM62 (Figures 4 & 5) group human, chimpanzee, mouse and cat in one clade.
This is a common problem with calculating phylogeny— there is no one universal method that is perfect for all sequences. With the same input, different algorithms might generate results that are very different from each other. Therefore, we should always double check and never rely solely on one calculation method.
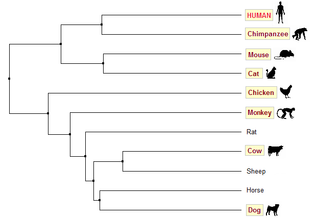
Figure 4. Average distance tree using BLOSUM62
|
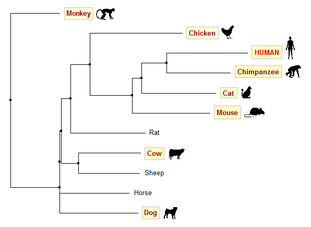
Figure 5. Neighbor joining tree using BLOSUM62
|
DNA phylogeny vs Protein phylogeny
In general, DNA phylogeny is more useful for closely-related species, whereas protein phylogeny is more useful for organisms of a wider range where the rate of evolution is quite different for each species.
Over the span of evolution, the likelihood of multiple substitutions at a single DNA base is huge; many substitutions were intermediate and unnoticeable. Due to this reason, DNA sequences alignment tends to underestimate the divergence time, thus generates incorrect phylogenetic trees that do not reflect the actual mutational history. On the contrary, protein sequences are more strictly conserved over much longer periods for the maintenance of essential protein function and protein structure. Therefore, protein phylogeny is usually more informative for distant species that diverge long ago. Whereas for closely-related species which diverge not very long ago, their protein sequences might not vary enough to provide sufficient information, but their DNA sequences usually do. Hence, DNA phylogeny is more useful for closely-related species. [6]
Over the span of evolution, the likelihood of multiple substitutions at a single DNA base is huge; many substitutions were intermediate and unnoticeable. Due to this reason, DNA sequences alignment tends to underestimate the divergence time, thus generates incorrect phylogenetic trees that do not reflect the actual mutational history. On the contrary, protein sequences are more strictly conserved over much longer periods for the maintenance of essential protein function and protein structure. Therefore, protein phylogeny is usually more informative for distant species that diverge long ago. Whereas for closely-related species which diverge not very long ago, their protein sequences might not vary enough to provide sufficient information, but their DNA sequences usually do. Hence, DNA phylogeny is more useful for closely-related species. [6]
References:
- Phylogeny. Biology Online. Retrieved Feb 24, 2014.
- Reading trees: a quick review. Understanding evolution. Retrieved Feb 24, 2014.
- Neighbor-Joining and UPGMA methods. PHYLIP. Retrieved Feb 24, 2014.
- Tree calculation. Jalview. Retrieved Feb 24, 2014.
- BLOSUM62. Rosalind. Retrieved Feb 24, 2014.
- Brown TA. (2002) Chapter 16, Molecular Phylogenetics. Genome. 2nd edition. Retrieved March 21, 2014.
